


I nearly gave up on bowler markets entirely after a frustrating run in 2017. Three months of disciplined analysis, and every top-bowler selection seemed to take two wickets instead of three while some part-time medium-pacer cleaned up with four. Then I reworked my model to weight conditions and phase-specific data over raw averages, and the results flipped. Bowler markets are the most underexploited corner of cricket betting because they demand a different analytical framework than batting markets, and most bettors simply do not build one.
How Top Bowler and Wicket Markets Work
The top bowler market mirrors the top batsman market in structure: you bet on which bowler will take the most wickets in an innings or match. Dead-heat rules apply when multiple bowlers tie for the highest wicket haul. Wicket-taker markets let you bet on specific bowlers to take a set number of wickets — over 1.5, over 2.5, and so on. Some bookmakers also offer bowler economy markets and bowler match-performance indices that combine wickets, economy, and dot-ball percentages into a single score.
The pricing of bowler markets is less efficient than batting markets because the underlying data is noisier. A batsman’s output is a single continuous variable — runs scored. A bowler’s output involves multiple discrete events — wickets, which are low-frequency occurrences influenced by luck, fielding quality, and umpiring decisions as much as bowling skill. A bowler who beats the bat twelve times in a spell and takes one wicket is statistically less impressive than a bowler who bowls four loose deliveries and takes three wickets from top-edged pulls. The market struggles to price this variance accurately, which creates opportunity for bettors who understand the underlying skill metrics rather than just the headline numbers.
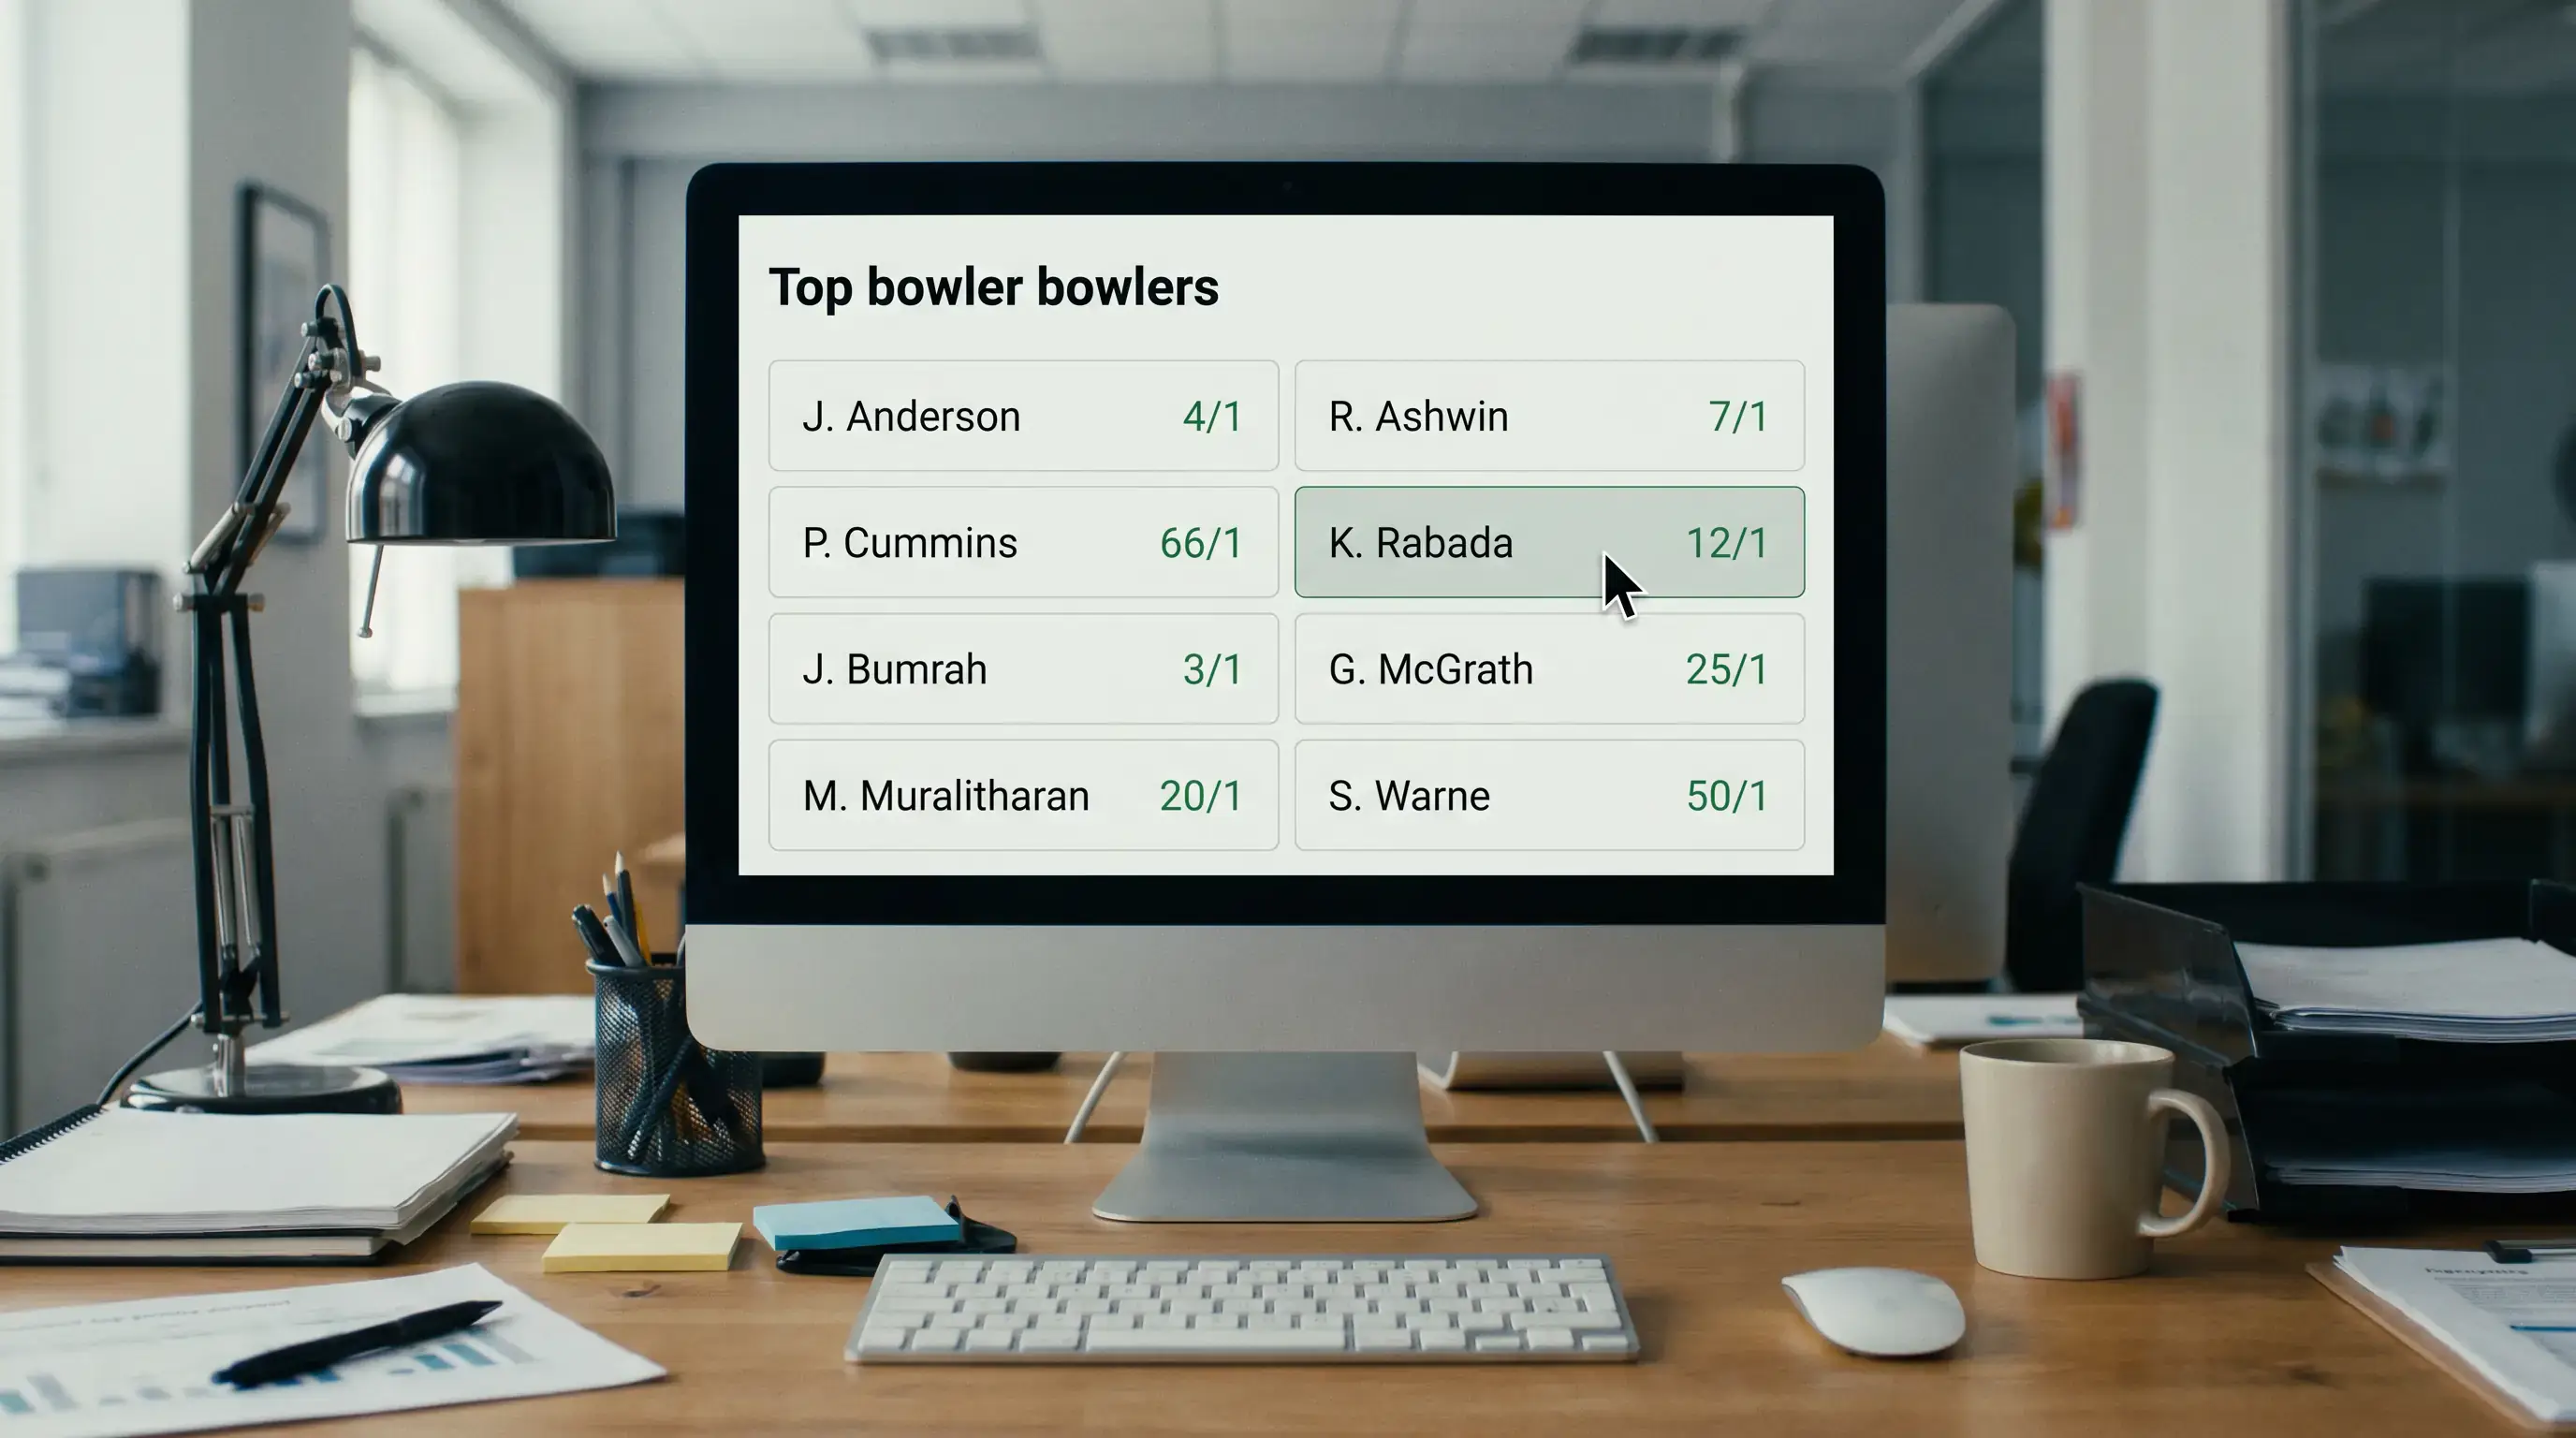
Bowling Statistics That Actually Predict Wickets
Average and economy rate are the default metrics, and they are the wrong ones for top-bowler betting. A bowler’s average tells you how many runs he concedes per wicket over his career. His economy rate tells you how many runs he concedes per over. Neither tells you how likely he is to take wickets in a specific match under specific conditions.
The metrics I use are strike rate (balls per wicket), dot-ball percentage, and phase-specific economy. Strike rate is the closest proxy for wicket-taking probability: a bowler who takes a wicket every 18 balls is more likely to top the wicket charts than one who takes a wicket every 30 balls, regardless of their respective averages. Dot-ball percentage measures pressure creation — bowlers who bowl more than 55% dot balls in T20 cricket are building pressure that leads to wickets, either from their own deliveries or from the batsman taking risks against them.
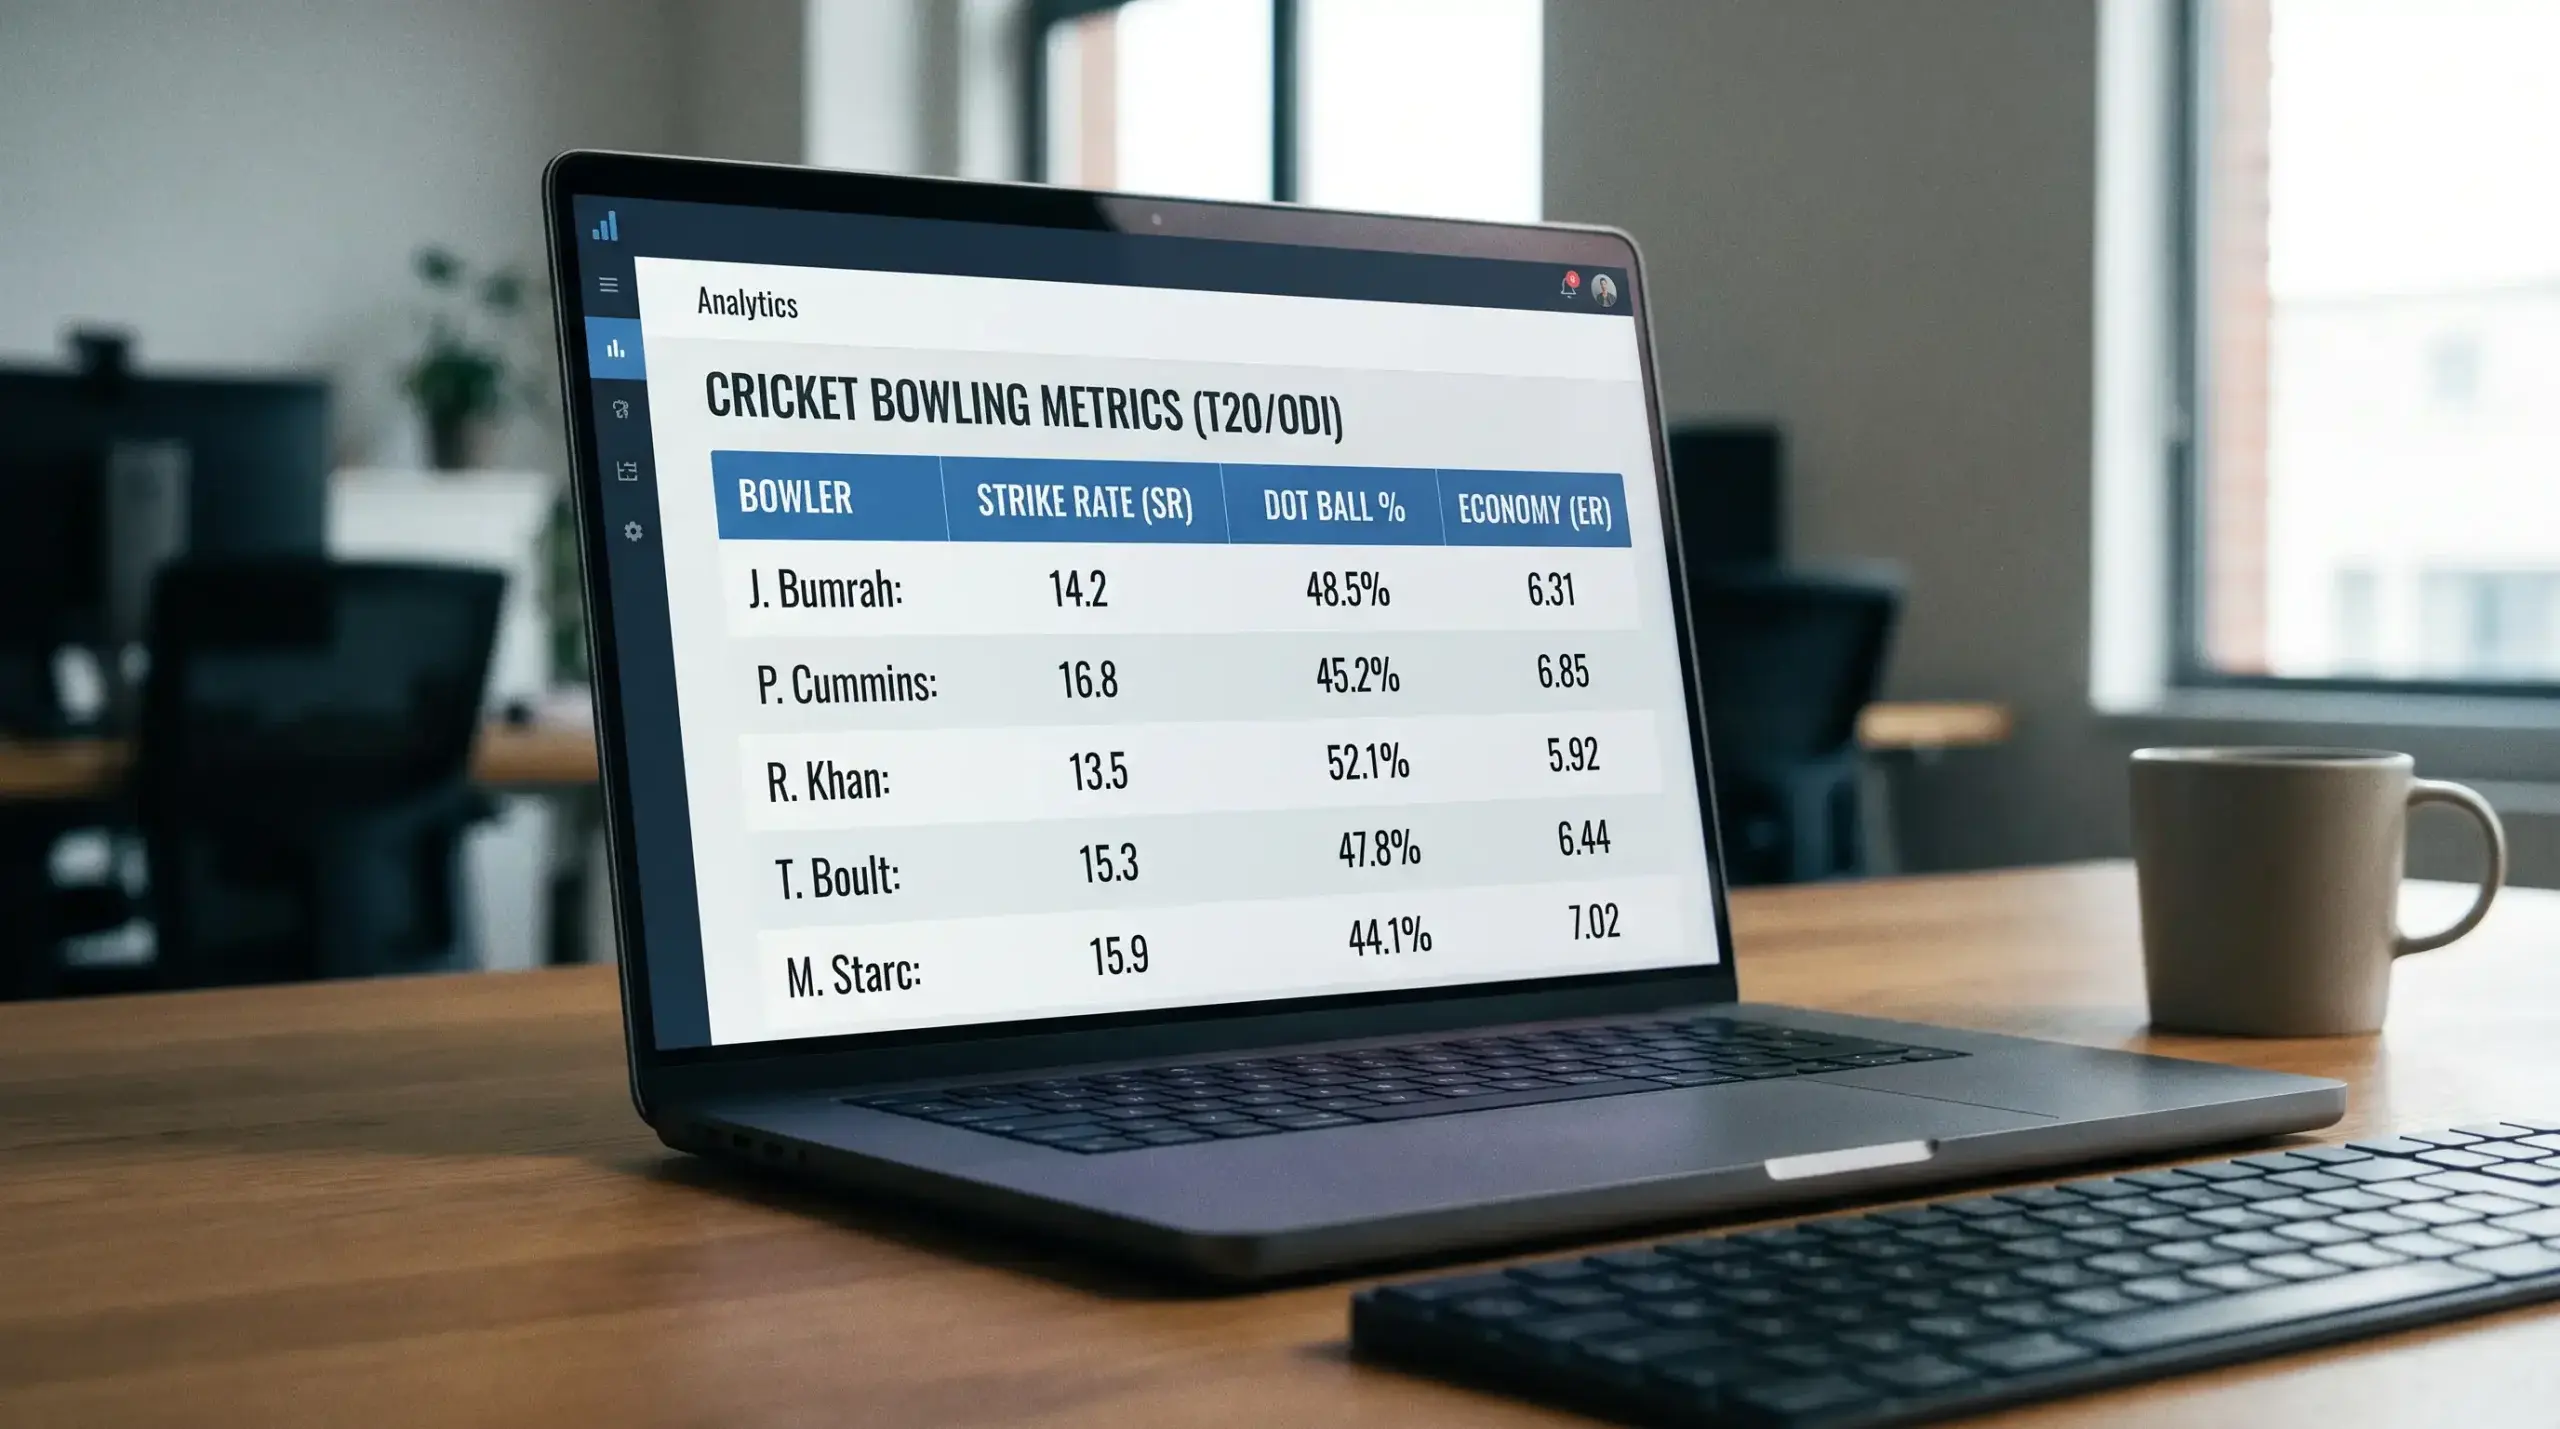
Phase-specific data is critical in limited-overs formats. A death bowler who concedes 10 runs per over but takes a wicket every 12 balls in overs 16-20 is a different prospect from a powerplay specialist who takes wickets at the same rate but in overs 1-6. The death bowler faces batsmen in attack mode who take more risks and offer more chances. The powerplay specialist faces set-up batsmen who play more conservatively. I separate my bowling data by phase and only compare bowlers who operate in similar phases against similar batting profiles.
Conditions That Create Bowling Value
Andrew Rhodes, the UK Gambling Commission’s chief executive, noted that operators are seeing a widening out of the sports offering, with sports beyond the traditional horseracing and football growing in use — cricket among them. That growth has deepened the bowler betting markets but has not made the pricing sharper, because the new money entering cricket markets is predominantly recreational and follows reputation rather than conditions analysis.
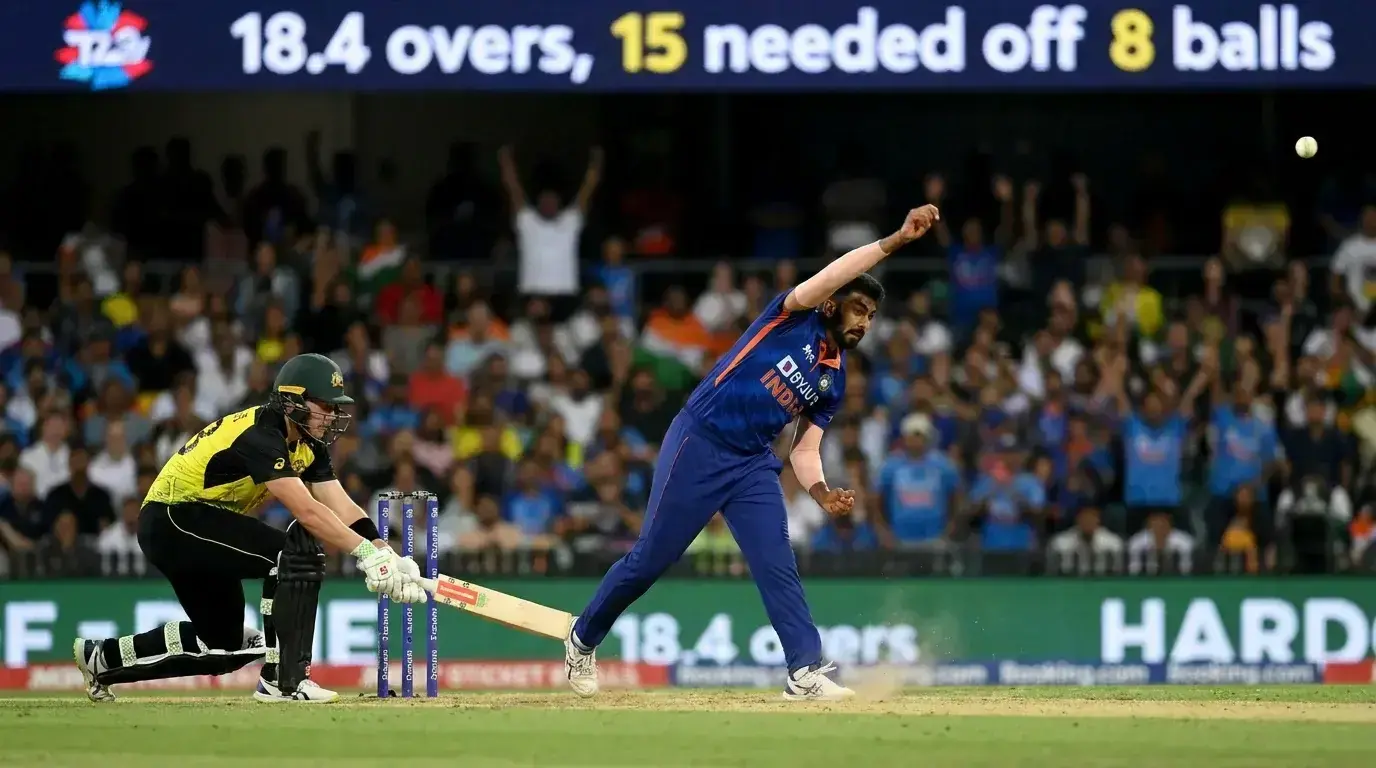
Seam-friendly conditions — green pitches, overcast skies, residual moisture from overnight rain — inflate the wicket probability for pace bowlers dramatically. In T20 cricket, where favourites win only 60-65% of matches, the upset rate of 35-40% is heavily concentrated on surfaces that assist bowling, where even a weak team’s attack can produce match-changing spells. I track the percentage of T20 matches where a pace bowler takes 3+ wickets at each venue and use that as a baseline for adjusting my top-bowler model upward on seam-friendly surfaces.
Spin-friendly conditions — dry, worn pitches with cracks and low bounce — create value for specialist spinners who can exploit turn and variable bounce. Sub-continental venues in the second half of a tournament, when pitches have been used repeatedly, often see spinners dominate the top-bowler market. The bookmaker’s model adjusts for venue-level spin data, but the adjustment is usually lagged by two or three matches — the algorithm needs observed data from the current tournament surface before it fully recalibrates. I manually accelerate that adjustment by watching how the pitch behaves in the first match at a venue and applying the data to my model before the second match.

Format-Specific Bowler Betting Edges
Test cricket is the most predictable format for bowler betting because the sample size within a match is larger — a bowler may bowl 25-40 overs across two innings. The top bowler in a Test is almost always one of the two frontline wicket-takers from the side that wins or draws. I focus my Test bowler bets on identifying which attack is better suited to the conditions and then selecting the bowler within that attack whose strike rate is lowest in similar conditions. The variance is lower than in limited-overs formats, and the model accuracy is meaningfully higher.
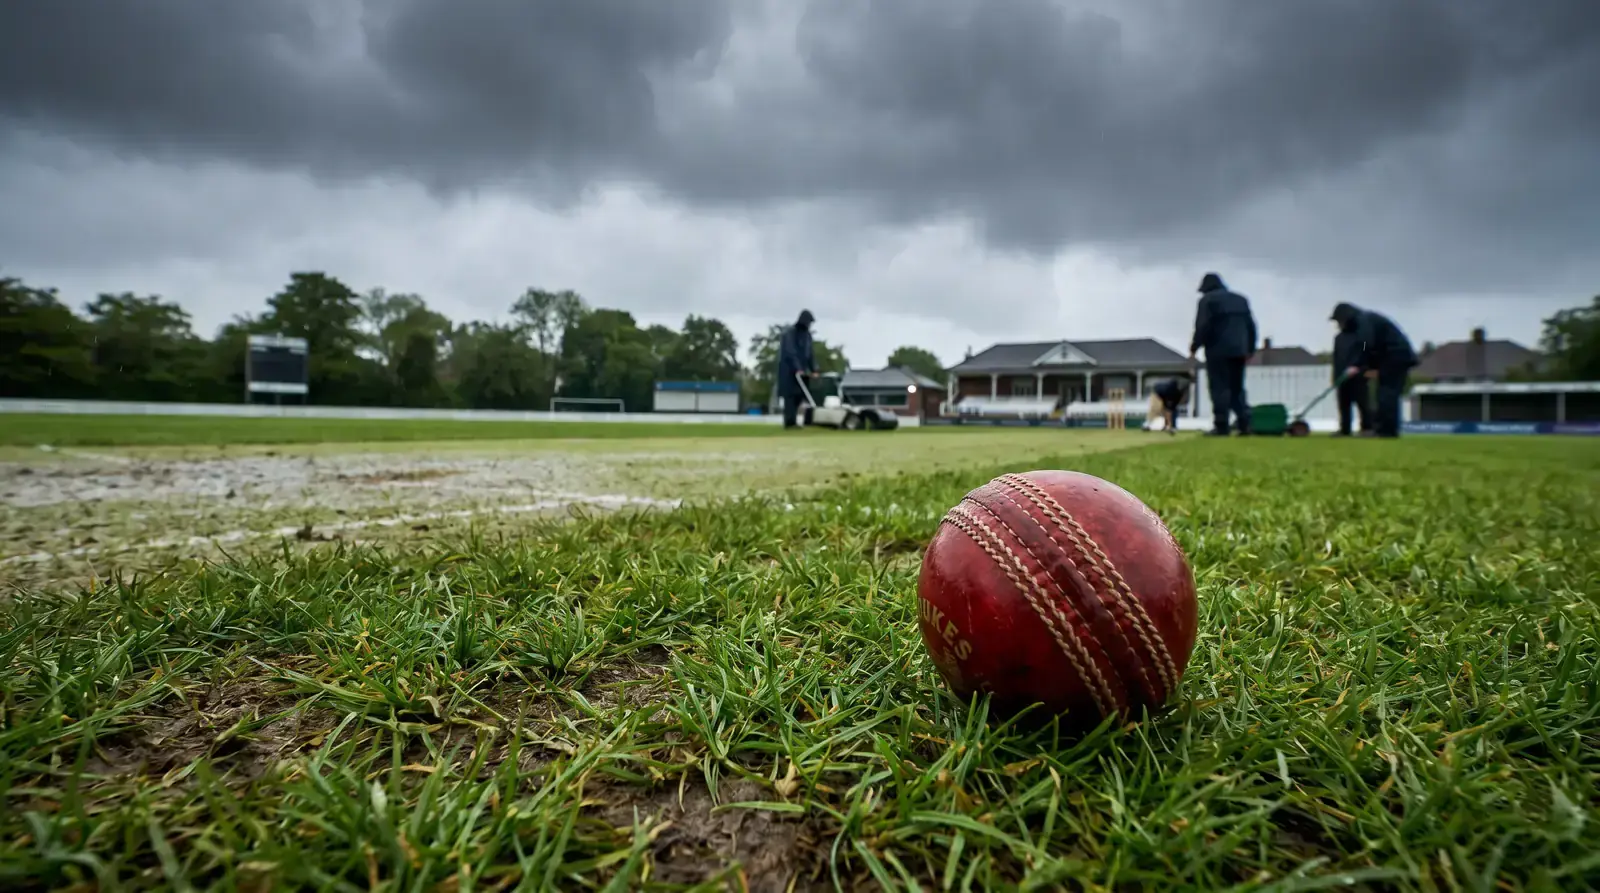
T20 bowler markets are higher variance but also carry the widest mispricings. A bowler who bowls four overs in a T20 has roughly 24 legal deliveries to take wickets. The expected number of wickets from those 24 balls, even for an elite bowler, is 1.5-2.0. That means the top-bowler outcome in a T20 is frequently decided by a single wicket — one slip catch, one LBW decision, one top-edged pull. I compensate for this variance by accepting wider edges before betting (at least 12% discrepancy between my probability and the bookmaker’s implied probability) and by distributing my bowler bets across multiple matches rather than concentrating on a single game.
ODI bowler markets sit between the two extremes. The 10-over allocation gives bowlers enough runway to generate meaningful data but not enough to smooth out all the variance. The middle overs (10-40) are where most ODI wickets fall, because batsmen transition from the conservative powerplay approach to acceleration and take more risks. Bowlers who excel in the middle overs — typically spinners and change-of-pace merchants — are consistently underpriced in the top-bowler market because the headline stats do not separate phase-specific performance. Cricket is the segment with the fastest projected growth rate in the global sports betting market, and bowler markets are where that growth is creating the most mispricing because the analytical tools have not caught up with the market depth.
