


I spent my first three years betting on cricket without anything that remotely resembled a strategy. I had opinions — strong ones — and I had access to a bookmaker account. That combination produced exactly the results you would expect: a slow, steady transfer of money from my bank balance to the sportsbook’s bottom line. The turning point came when I stopped asking “who will win?” and started asking “what does the market believe, and where is it wrong?”
That question changed everything. Cricket generates roughly £52 million in annual gross gambling yield across the UK, representing about 2.2% of the online sports betting market. It is a niche — but a niche with structural inefficiencies that reward disciplined, analytical bettors. The bookmakers price football with laser precision because millions of eyes are on every Premier League match. Cricket markets, particularly domestic and franchise competitions, receive far less scrutiny. That is where your edge lives.
Over twelve years of building models, tracking results and refining my approach, I have arrived at a set of analytical frameworks that consistently outperform gut-feel punting. This is not a collection of hot tips. It is a system — a way of thinking about cricket betting that you can adapt, test and improve. Whether you are placing your tenth bet or your ten-thousandth, the frameworks here will give you a structured advantage over the majority of the market.
Why a Data-Driven Approach Changes Everything
Three summers ago, I backed England to beat South Africa in a T20 series. My reasoning was simple: England were at home, in form, and the crowd would be behind them. I lost. Not because my read on the series was catastrophically wrong, but because I had not considered that the implied probability baked into the odds already accounted for all of those factors — and then some. The bookmaker had priced England shorter than the data justified, and I had paid a premium for consensus opinion.
A data-driven approach strips away the narrative and forces you to confront what the numbers actually say. In T20 cricket, favourites win only 60-65% of matches, leaving a 35-40% upset rate that most casual bettors drastically underestimate. That single statistic should reshape how you view every T20 market you encounter. If the favourite is priced at 1.50 (implying a 66.7% win probability) but the format’s baseline says they should win closer to 62% of the time, you are paying too much. The value sits with the underdog — or with passing on the bet entirely.
The foundations of any data-driven cricket betting strategy rest on three pillars. First, you need historical performance data segmented by format, venue and conditions. A batsman’s overall average tells you almost nothing useful — you need their average on green pitches, against left-arm pace, in the first innings of a day-night match. Second, you need a method for converting that data into probability estimates. This does not require a PhD in statistics; it requires a spreadsheet and the discipline to use it consistently. Third, you need a system for comparing your probability estimates against the bookmaker’s implied probability to identify where value exists in cricket betting.
The Sportradar Integrity Report for 2025 highlighted something relevant here: match-fixing remains a genuine threat, with 59 suspicious cricket matches flagged during the year. Andreas Krannich, Sportradar’s Executive Vice President for Integrity Services, noted that while the relative stabilisation of suspicious match numbers was encouraging, sustained investment in technology and intelligence remains essential to staying ahead of corruption. For the data-driven bettor, this underscores a practical point — your models should include integrity signals. Sudden, unexplained odds movements in lower-tier tournaments, particularly in T20 franchise leagues with limited broadcast coverage, are not noise. They are data points that should trigger caution, not opportunity.
Cricket sits at the fastest-growing edge of the global sports betting market, driven primarily by the proliferation of T20 leagues and emerging formats such as The Hundred. That growth means more markets, more liquidity and more opportunities for the bettor who can identify where bookmaker pricing lags behind reality. But it also means more noise, more tipster services selling certainty and more temptation to abandon your framework when a losing run hits. The data-driven approach is not a guarantee of profit. It is a guarantee that your decisions will be grounded in evidence rather than emotion.

The Pre-Match Analysis Checklist I Use Before Every Bet
Every profitable cricket bet I have ever placed started with the same ritual — not a lucky shirt or a particular seat, but a checklist. I run through it before I even open a bookmaker’s app. The purpose is not to predict the result. The purpose is to build an informed probability picture and then compare it against what the market offers. If the market agrees with me, there is no bet. If it disagrees and I can identify why, there is an opportunity.
The checklist starts with pitch and conditions. I look at the venue’s recent history: what have the last five matches at this ground produced? High-scoring flat decks, or low, slow turners? If it is a ground I know well — Lord’s, Edgbaston, The Oval — I already have a baseline. If it is a ground in the subcontinent with less available data, I spend more time here. I check the pitch report from broadcasters and journalists who are physically at the ground, not aggregated previews written from a desk. A “green tinge” mentioned by a reporter on the morning of a Test match changes the complexion of the entire market. That detail is worth more than ten pages of historical batting averages.
Next, I assess team composition and selection. Has the side made late changes? Is a key bowler carrying a niggle that might limit their workload? In franchise cricket, squad rotation is endemic — a team might rest their international pace attack for a dead rubber, fundamentally altering the match dynamics. I cross-reference the announced eleven with historical matchup data. How does the batting lineup perform against the specific bowling attack they are facing? Left-arm pace is not the same as right-arm pace. Off-spin is not the same as leg-spin. The granularity matters.
Form comes third, and I treat it with scepticism. A batsman who has scored three consecutive fifties might appear to be in superb touch, but if those runs came on flat pitches against weak attacks, the form is inflated. Conversely, a bowler whose last three outings show expensive figures might have been unlucky — a high dot-ball percentage and good lengths can produce poor results when catches go down or edges fly through gaps. I use a rolling window of five to ten matches depending on the format, and I weight recent performances by quality of opposition and conditions faced.
Weather is the fourth check. Overcast skies in England favour swing bowling, which tilts the match towards sides with quality new-ball operators. Dew in evening matches across the subcontinent and even in English summer conditions can make the ball slippery for bowlers in the second innings, giving a meaningful advantage to the chasing side. I use multiple weather sources — not just the generic forecast, but hour-by-hour breakdowns that tell me whether cloud cover will persist through the first session or burn off by lunch.
The fifth and final check is toss impact. In many conditions, the toss is a coin flip with minimal strategic consequence. In others — a crumbling day-five pitch, a dew-heavy evening match — it is decisive. I assess how much the toss is likely to matter at this venue, in these conditions, on this day, and factor that uncertainty into my probability model. If the toss outcome could swing the match by ten percentage points or more, I either wait until after the toss to bet or adjust my stake to reflect the added uncertainty.
Running through this checklist takes between twenty minutes and an hour depending on the match. It is not glamorous work. But it is the work that separates a bettor with a strategy from someone scrolling through odds on their phone during a lunch break.

Format-Specific Angles: Where Generic Strategy Falls Apart
One of the most expensive lessons I learned early on was treating all cricket as the same sport. It is not. A T20 between Mumbai Indians and Chennai Super Kings has about as much in common with a five-day Test at Headingley as a 100-metre sprint has with a marathon. The skills overlap, but the strategic reality — and therefore the betting reality — is fundamentally different. Any strategy that does not account for format-specific dynamics is a strategy that leaks money.
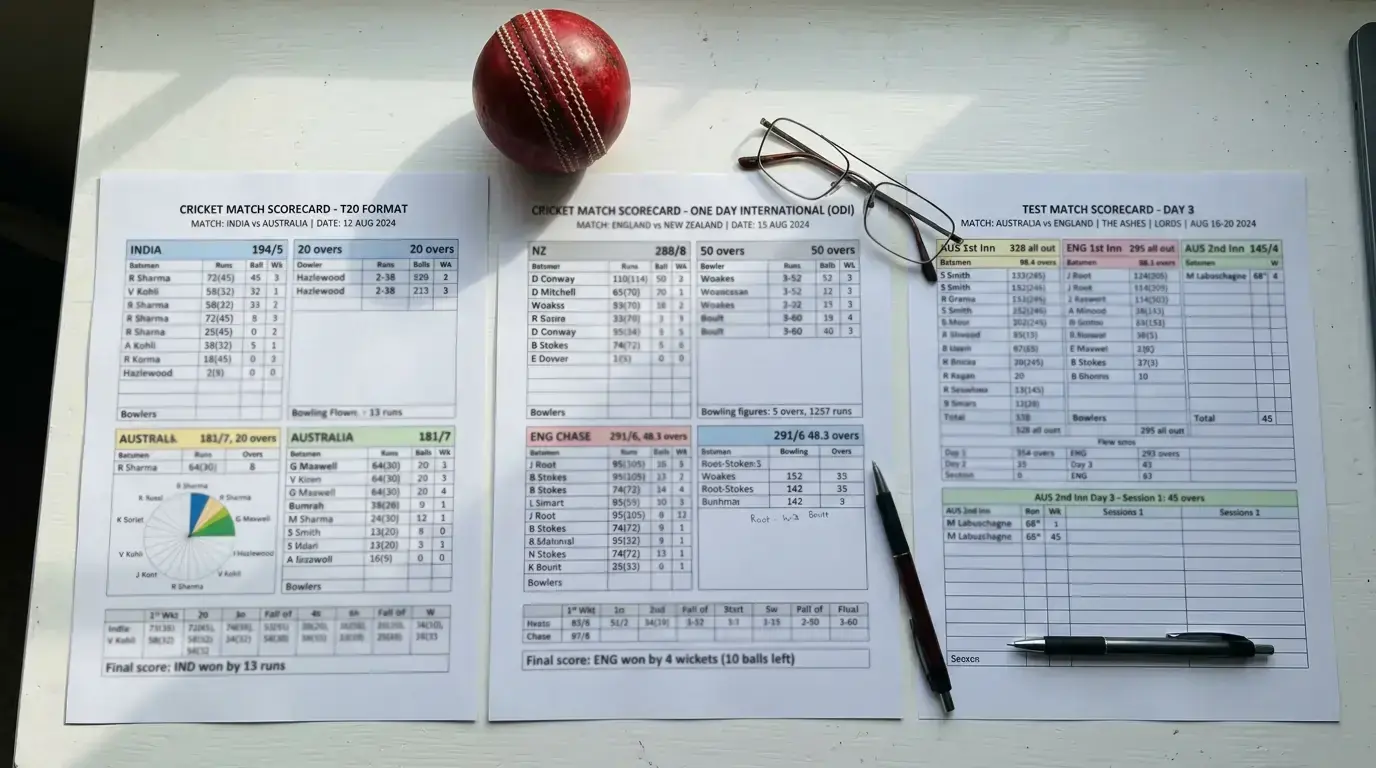
The key difference is predictability. Test cricket rewards the better team over five days, with enough time for quality to assert itself. The draw is a genuine market outcome, and conditions evolve day by day as the pitch deteriorates and the weather shifts. ODI cricket sits in the middle — enough overs for the better side to establish control, but with the DLS method introducing complexity in rain-affected matches and middle-over lulls creating tactical sub-plots. T20 cricket is chaotic by design: twenty overs is not enough time to guarantee that the stronger side prevails, which is precisely why the upset rate is so high and why the format demands a completely different analytical lens. Your strategy must account for these structural differences or it will fail.
T20: Volatility as an Asset
T20 is where I allocate the largest share of my betting activity, and it is not because I love the format — it is because the market inefficiencies are largest. The upset rate I mentioned earlier means that implied probabilities baked into bookmaker odds are frequently mispriced. Casual bettors pile onto familiar names — India, Australia, Mumbai Indians — and the market overreacts to recent form because the sample sizes are so small.
My T20 approach centres on three metrics: powerplay scoring rates, death-over bowling economy and boundary percentage. A side that scores at 9+ runs per over in the powerplay and defends well at the death has a structural advantage that does not always show up in headline results. I also pay close attention to venue-specific scoring patterns. A ground where the average first-innings total is 170 plays very differently from one where 145 is par, and the over/under lines do not always reflect this accurately.
The other T20 edge sits in the underdog market. Because volatility is inherent in the format, backing underdogs at odds of 3.00 or higher can be profitable over a large sample even with a win rate below 40%. The mathematics are straightforward — you do not need to be right often if the payoff when you are right is large enough.

Test Cricket: The Long Game Within the Long Game
Test cricket demands patience — both in watching the match and in placing your bets. I rarely bet on a Test match before seeing the pitch on the morning of day one, and I almost never bet on the match winner market before the toss. The draw is the structural feature that makes Test betting unique, and it is chronically underpriced in markets where casual bettors gravitate towards a winner.
My Test strategy focuses on session betting and in-play markets rather than pre-match outright bets. A Test match unfolds across fifteen sessions, and each session presents fresh information that the market is slow to digest. If a side posts 280/3 on day one on a flat pitch, the draw price will shorten overnight — but often not by enough to reflect the true likelihood. Day-by-day pitch deterioration is the single most important factor in Test betting, and most bookmakers are better at pricing the first innings than the fourth. That asymmetry is where I find the most consistent value.
I also track how teams perform when behind in a series. History shows that sides trailing 1-0 in a five-match series often produce their best cricket in the next Test, creating value against the market’s tendency to extrapolate from the most recent result.
Integrating Staking Into Your Strategy
The best analytical framework in the world is worthless without a staking plan that keeps you solvent through the inevitable losing runs. I have seen sharp bettors — people with genuine edges in their models — blow up their bankrolls because they staked too aggressively on individual matches. Strategy and staking are not separate disciplines. They are two halves of the same system.
My approach is straightforward: every bet is sized as a percentage of my current bankroll, not my starting bankroll. When my bankroll grows, my stakes grow proportionally. When it shrinks, my stakes shrink. This ensures that no single losing streak can wipe me out. For most bettors, a flat stake of 1-3% of bankroll per bet provides a solid foundation. More aggressive approaches — fractional Kelly, for instance — can increase long-term growth but require precise probability estimates that most bettors, myself included in my early years, struggle to produce consistently.
The critical link between strategy and staking is confidence calibration. Not every bet in my model carries the same edge. A match where my probability estimate diverges from the market by two percentage points is a different proposition from one where the divergence is eight points. I adjust my stake accordingly — smaller on low-conviction bets, larger when my model and the conditions analysis strongly disagree with the market. If you want to go deeper into unit systems, variable staking and the mathematics behind bankroll management, it is worth dedicating serious time to that discipline. Getting the analysis right and the staking wrong is a recipe for frustration.
Tracking Performance: The Habit That Separates Professionals From Punters
In 2019, I thought I was profitable at live cricket betting. I had a clear memory of several big wins during that summer’s Ashes, and I could recall the specific bets in vivid detail. When I finally sat down and reviewed my actual records, the picture was different. My pre-match bets were profitable. My live bets — where I was making rapid decisions fuelled by adrenaline and ball-by-ball momentum — were losing money steadily. Without the tracking data, I would have continued pouring money into a leaking pipe.
Live betting accounts for approximately 55-60% of all cricket wagers placed in the UK. That statistic alone tells you how much of the market is operating in the fast-paced, emotionally charged environment of in-play wagering. If you are not tracking your performance across different bet types, formats and markets, you have no way of knowing where your edge actually lies — or where it doesn’t.
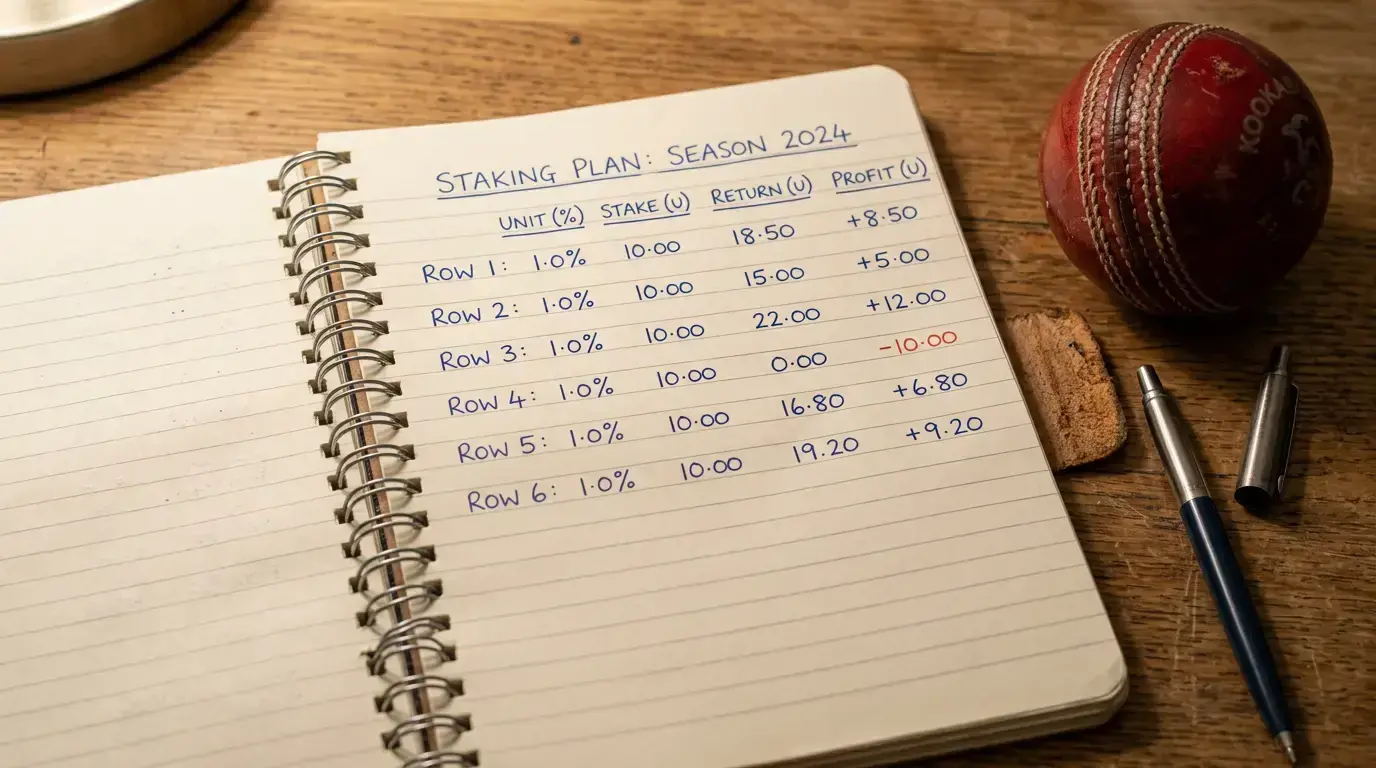
A tracking system does not need to be complex. At minimum, record the date, match, market, selection, odds, stake, result and profit or loss for every bet. Over time, add columns for your estimated probability, the market’s implied probability, the format (T20, ODI, Test) and whether the bet was pre-match or in-play. This data becomes the foundation of your strategic evolution. After a hundred bets, you can start calculating your yield — the percentage profit per pound staked — across different segments. After five hundred bets, the patterns become statistically meaningful.
The most valuable insight from tracking is often negative: discovering what you should stop doing. I discovered that my over/under runs bets in ODI cricket were consistently unprofitable, not because the market was too efficient, but because I was systematically overestimating scoring rates at grounds where pitches had changed character over recent seasons. Without the data, that bias would have remained invisible.
Review your records at the end of every month and at the end of every cricket season. Look for trends, not individual results. A losing month means nothing in isolation. A losing format across three consecutive seasons means your model for that format needs rebuilding. Treat your betting record with the same rigour you would treat a business’s profit-and-loss statement — because that is exactly what it is.