


I went bust twice in my first two years of cricket betting. Not because my analysis was wrong — my strike rate on selections was above 55% — but because I had no system for managing what I risked. I would put 20% of my bankroll on a “certainty,” watch it lose, then chase the loss with another oversized bet. By the end of month three, I had turned a profitable model into a depleted account. Bankroll management is not the glamorous part of betting, but it is the part that determines whether you survive long enough for your edge to compound. Roughly 48% of UK adults participate in some form of gambling, and the vast majority of them have no staking system whatsoever.
The Unit System: Your Bankroll’s Operating Language
A unit is a standardised fraction of your total bankroll, and it becomes the currency in which you think about every bet. I use a 100-unit bankroll — if my total betting fund is GBP 2,000, one unit is GBP 20. Every bet I place is sized in units rather than pounds, which detaches the emotional weight of money from the analytical process. Betting “2 units” on a cricket match feels different from betting “40 quid,” even though they are the same amount. The psychological distance matters.

The standard recommendation is to risk 1-3% of your bankroll per bet, which translates to 1-3 units in a 100-unit system. I stick to 1-2 units for standard bets and reserve 3-unit bets for selections where my model shows a probability edge exceeding 12% over the bookmaker’s implied price. Over a typical cricket season, I place 150-200 bets, and capping each at 1-3% of bankroll means that even a losing streak of 10-12 bets (which happens roughly twice a year) costs 10-36% of my bankroll rather than wiping it out. Recovery from 36% down is achievable. Recovery from bust is not.
Recalibrating your unit size is essential and often neglected. If your bankroll grows from 2,000 to 3,000, your unit should increase from 20 to 30. If it drops to 1,500, your unit drops to 15. I recalculate at the start of each month. This dynamic adjustment means you bet more when winning (compounding your edge) and less when losing (protecting your capital). It is the simplest form of risk management and it works.

Flat Staking Versus Variable Staking
Andrew Rhodes, the UK Gambling Commission chief executive, touched on a tension that applies directly to staking strategy: the balance between individual freedom and protection. In staking terms, this is the debate between flat and variable approaches — simplicity versus optimisation, safety versus growth.
Flat staking means betting the same number of units on every selection regardless of your confidence level. It is the simplest system, the easiest to track, and the most robust against estimation error. If your model is slightly miscalibrated, flat staking limits the damage because you never overexpose on a single bet. I used flat staking for my first five years and it served me well. The downside is that it treats a 12% edge the same as a 3% edge, which leaves potential growth on the table.

Variable staking means adjusting your stake based on the perceived edge. A bet with a 12% probability advantage gets 3 units; a bet with a 5% advantage gets 1 unit. This approach maximises expected bankroll growth if your probability estimates are accurate, but it amplifies losses when they are not. I switched to variable staking after five years because my model had enough track record to justify confidence in its probability outputs. The key condition is track record — if you have fewer than 500 bets logged with your current model, stick with flat staking until the data justifies the switch.

For value betting in cricket specifically, I use a modified Kelly approach (quarter Kelly) to determine variable stakes. This ensures my stake size is mathematically proportional to my estimated edge and the odds available, while the quarter-Kelly modifier dampens the volatility that full Kelly would produce.
ROI and Yield: Measuring What Matters
ROI and yield are not the same thing, and confusing them will give you a distorted picture of your performance. ROI (return on investment) measures your total profit or loss as a percentage of your total stakes. If you staked GBP 5,000 across a season and finished with GBP 5,300, your ROI is 6%. Yield measures your average return per bet — total profit divided by total stakes, expressed per bet. Over 200 bets with GBP 5,000 staked and GBP 300 profit, your yield is 6% overall, or GBP 1.50 per bet on average.
In the UK, 10% of the population bet on sports online. Among those, the vast majority track neither ROI nor yield, which means they have no idea whether their approach is working. I track both figures monthly and cumulatively. A positive yield over 200+ bets is statistically meaningful. A positive yield over 50 bets might be variance. I do not draw conclusions about my model’s effectiveness until I have at least a 200-bet sample in a specific market or format.

The benchmarks I use: a yield of 3-5% over a season of 200+ cricket bets is solid. A yield of 5-8% is excellent and suggests a genuine edge that has not yet been competed away. Anything above 8% sustained over multiple seasons is exceptional and rare. If my yield in a specific market drops below 2% for two consecutive quarters, I re-evaluate whether the edge has eroded and whether I should reallocate my volume to markets where my performance is stronger.
Tracking Tools and the Discipline of Record-Keeping
Every bet I place gets logged in a spreadsheet within ten minutes — date, match, market, selection, odds, stake (in units), and outcome. I add conditional fields for format (T20/ODI/Test), competition, venue, and weather conditions so I can filter my performance data by any variable. This granularity allows me to answer questions like “what is my yield on T20 top batsman bets at subcontinental venues?” — questions that reveal where my edge is strongest and where it has disappeared.
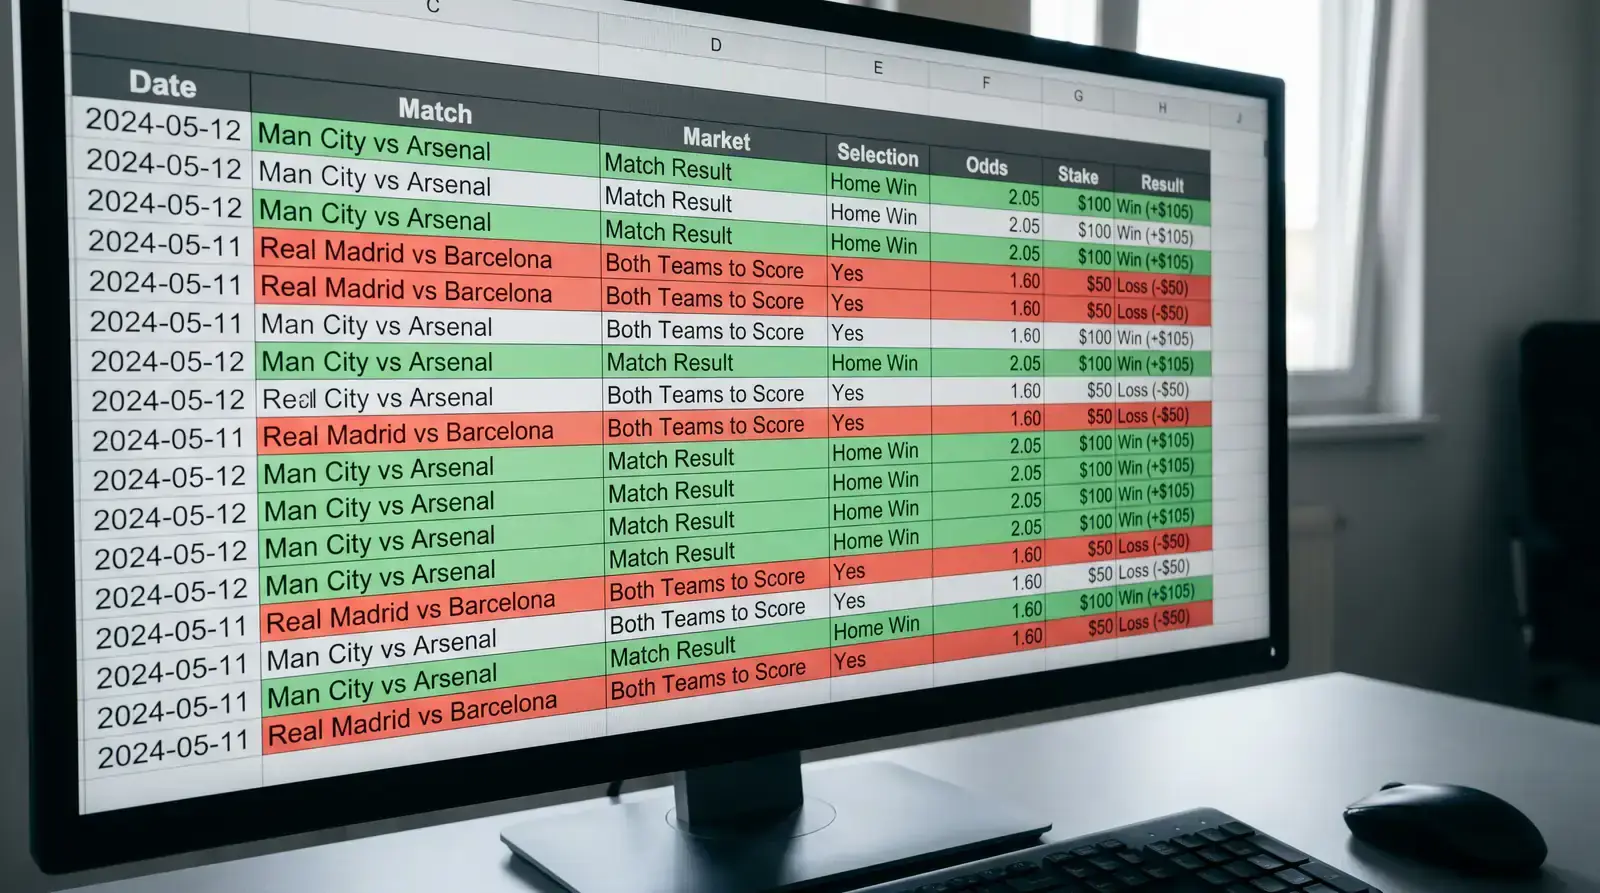
I have tried dedicated betting tracker apps and always returned to a spreadsheet. The reason is flexibility — apps impose a structure, while a spreadsheet lets me add any field I need and build custom analyses. The one non-negotiable tool outside the spreadsheet is a probability calculator that converts between odds formats and calculates implied probability, Kelly fraction, and expected value in real time. I built mine in a simple Excel sheet with formulas that update automatically when I input the odds and my probability estimate.
The discipline of logging every bet is the hardest part of bankroll management. It is easy to skip the losing bets and only record the winners, which gives you a falsely positive picture. I force the habit by logging bets at the point of placement rather than after the result, which removes the temptation to revise history. If your tracking data is honest, it will tell you everything you need to know about whether your approach is working. If it is not honest, nothing else matters.
