


I spent the first three years of my cricket betting career treating batting average as gospel. If a player averaged 48 in ODIs, I assumed he was a 48-average player in every match, on every surface, against every bowling attack. Then I ran a simple analysis on my top-batsman bets and discovered that my hit rate on players with high overall averages was barely better than random. The averages were real, but they were hiding so much contextual variation that they were almost useless for match-specific prediction. That realisation — that aggregate statistics obscure the details that drive individual match outcomes — is the foundation of everything I now do with batting data.
Why Batting Average Misleads More Than It Reveals
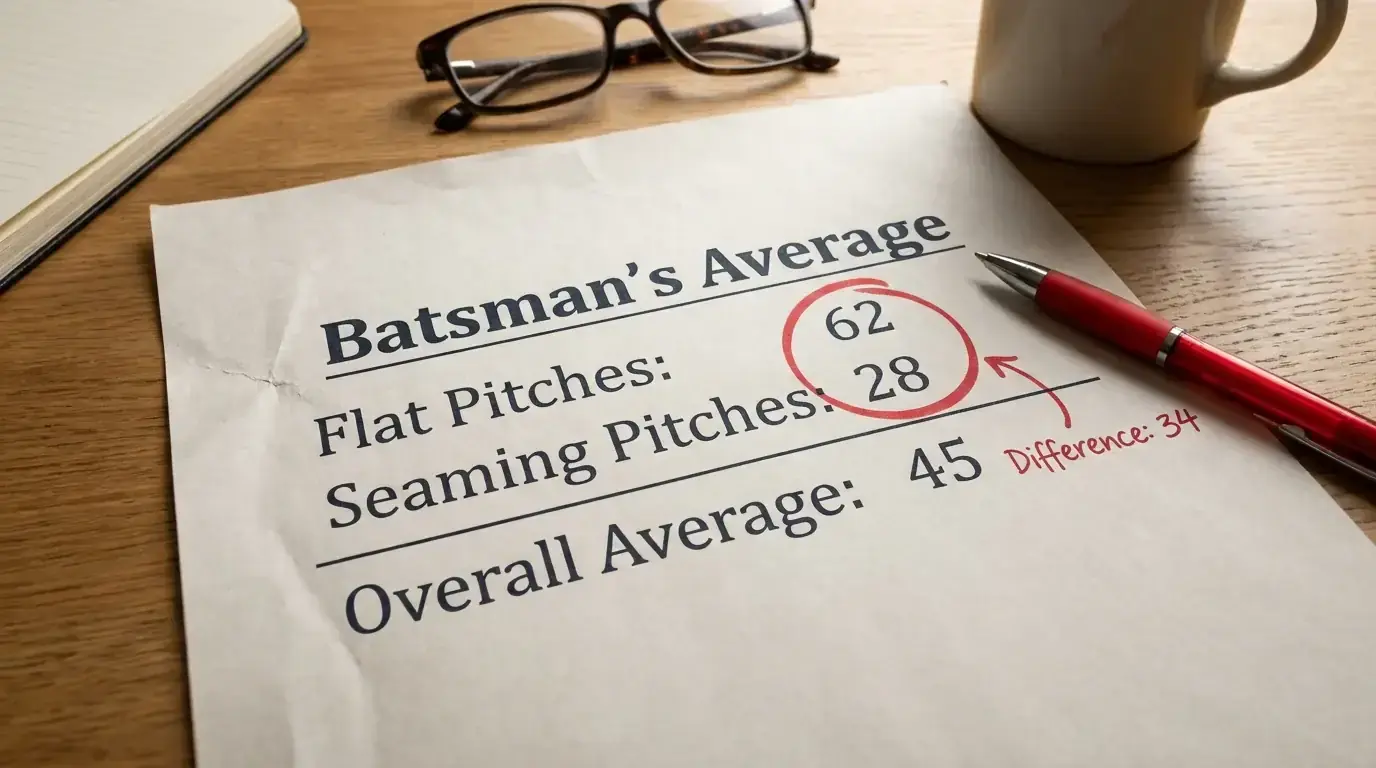
Batting average is calculated by dividing total runs by total dismissals. It tells you how many runs a player scores, on average, before getting out. The problem for betting purposes is that this single number flattens an enormous range of performance into a point estimate. A player who averages 45 might have scored 120 on a flat pitch in Rajkot and 8 on a green top at Headingley. His average is 45, but his expected score in your next bet depends entirely on which type of surface he is facing.
The misleading quality of average is amplified by not-out innings. In limited-overs cricket, a batsman who frequently bats through the innings accumulates not-outs that inflate his average without reflecting greater skill. A number-five batsman who makes 30 not out six times and 10 twice has an average of 100 — a meaningless number for betting because his most likely score in any given innings is around 25-30, not 100. I adjust for not-outs by using “batting median” — the middle value of a player’s last 20 innings scores — as a more honest measure of expected output.
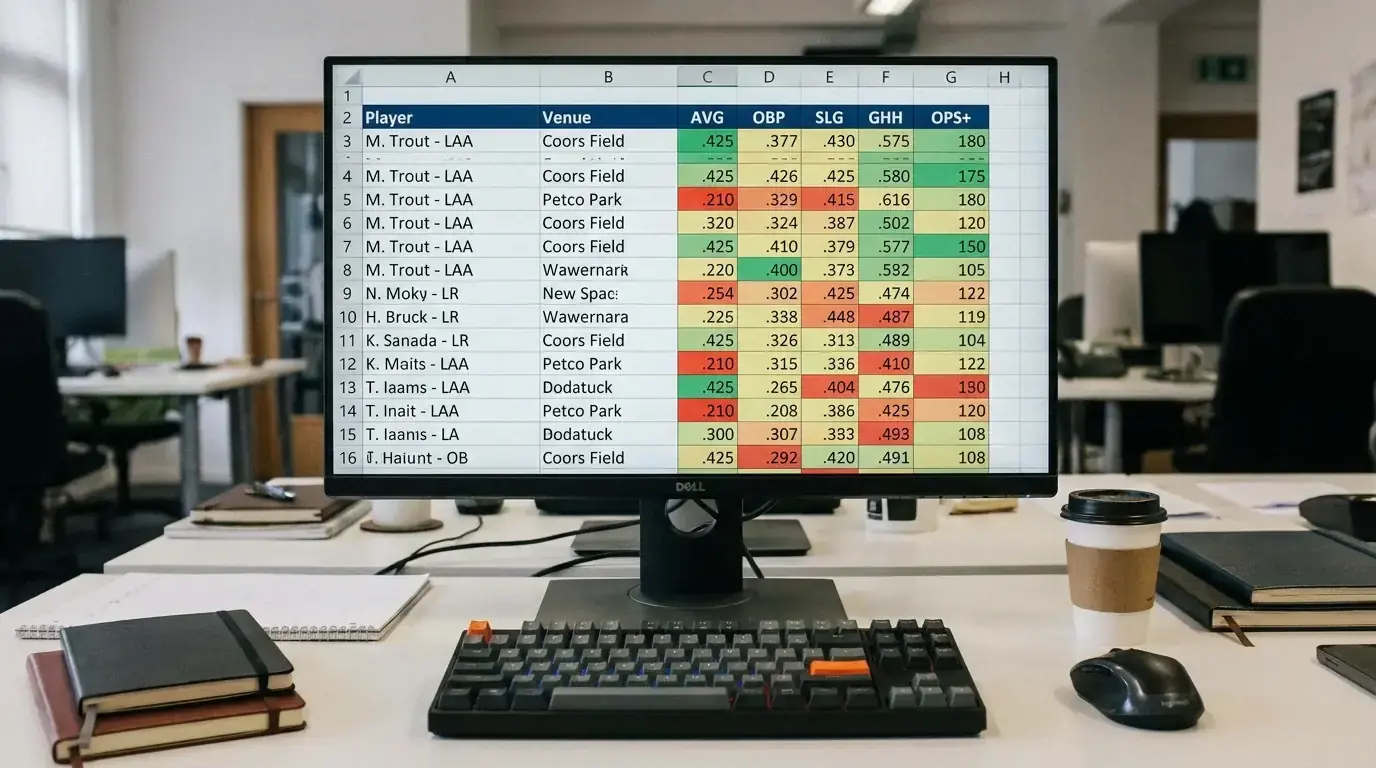
Venue-specific average is the first correction I apply. A batsman’s record at a specific ground, or on a specific type of surface, is far more predictive than his overall career number. The data requirements are demanding — you need at least five innings at the venue or on similar surfaces to draw useful conclusions — but the predictive improvement is significant. I maintain a spreadsheet of batting averages split by surface type (flat/seam-friendly/spin-friendly) for every player I model, updated after each series. Cricket’s position as the fastest-growing segment in global sports betting has made this data more accessible than ever, with platforms like CricViz and ESPNcricinfo providing granular venue splits that would have required manual compilation a decade ago.
Strike Rate in Context: When Speed Matters and When It Does Not
Strike rate — runs scored per 100 balls faced — is the metric that T20 has elevated to near-religious status. A batsman who strikes at 150 is valued more highly than one who strikes at 120, regardless of their respective averages. For betting, the question is more nuanced: does strike rate predict match outcomes, or is it a consequence of the situations a batsman faces?
In T20 cricket, where favourites win only 60-65% of matches and the upset rate sits between 35-40%, strike rate in the powerplay and death overs correlates strongly with match results. A team whose openers strike above 140 in the first six overs puts scoreboard pressure on the opposition that compounds through the innings. But a high overall strike rate that is concentrated in the death overs — a “finisher” profile — has a different predictive value. The finisher faces fewer balls, faces them in higher-pressure situations, and is more dependent on match context than on inherent quality.
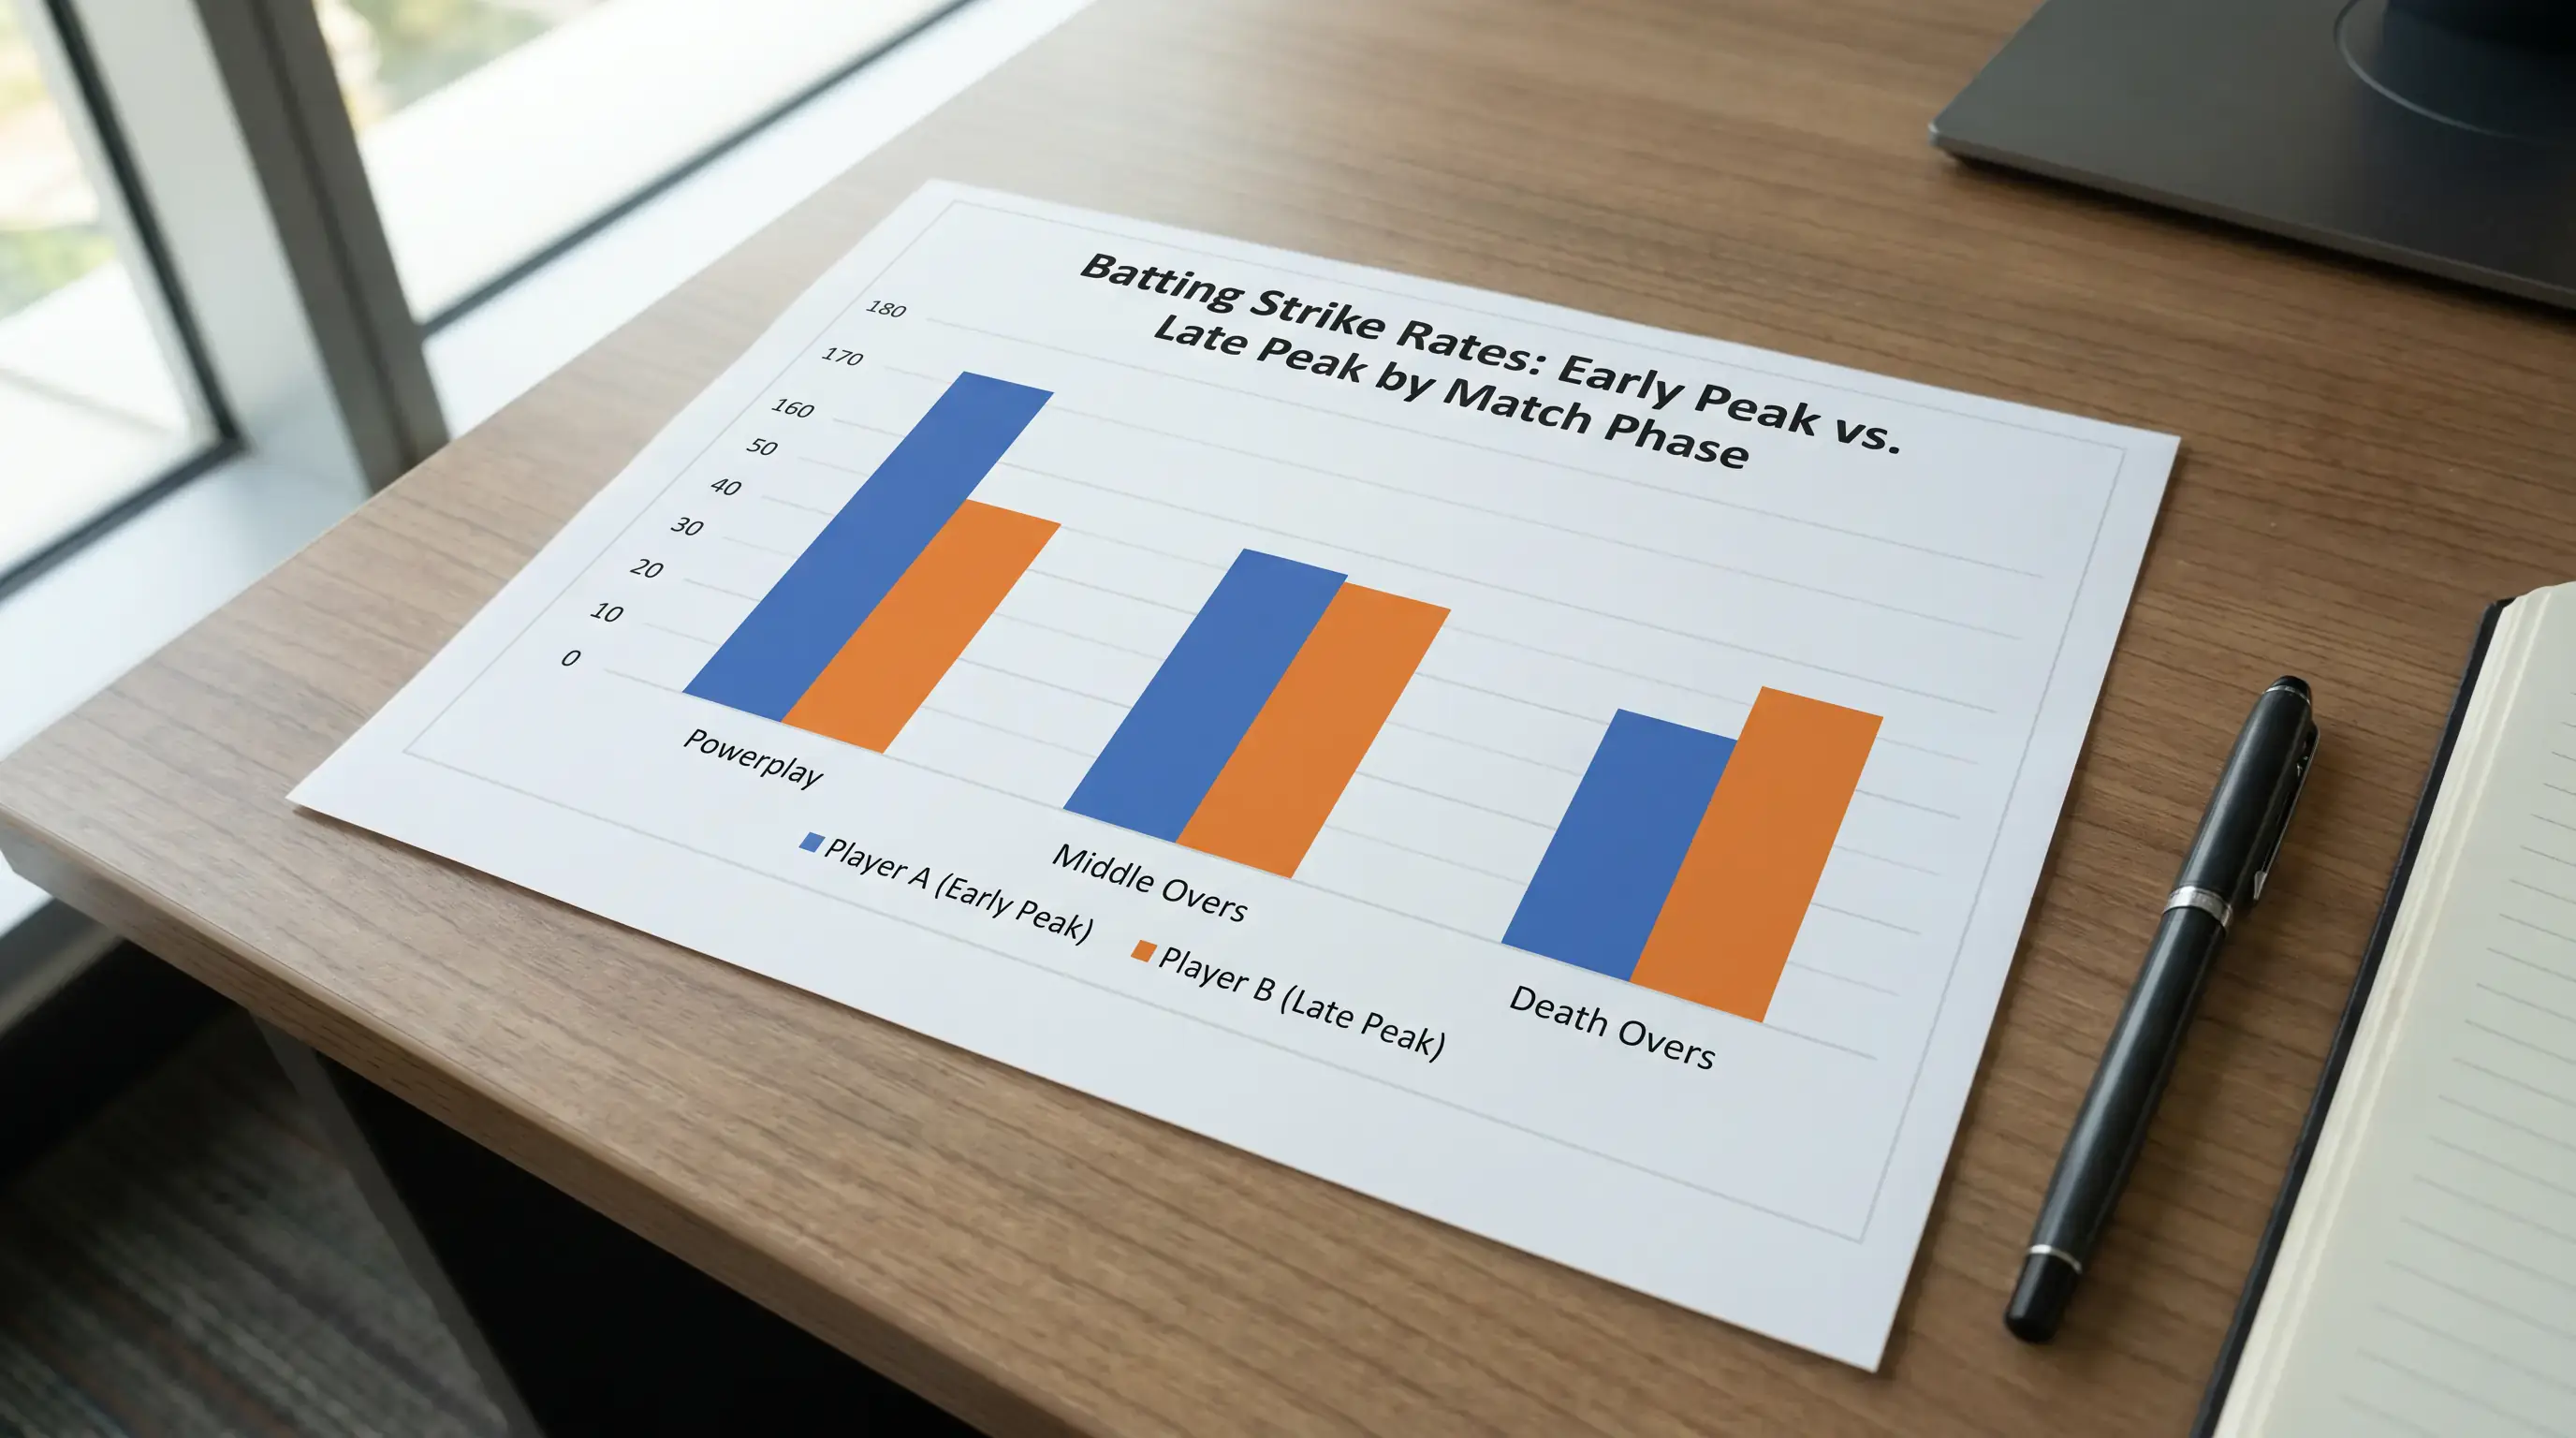
I separate strike rate by phase (powerplay, middle overs, death) and by match situation (batting first versus chasing, defending a total versus building one). A batsman who strikes at 155 in the death overs while chasing is a different asset from one who strikes at 155 in the death overs while batting first. The chaser is responding to a required rate; the first-innings hitter is dictating one. For cricket betting strategy purposes, the first-innings strike rate is a better measure of inherent attacking ability because it is less influenced by external targets.
Venue and Conditions Splits: The Data That Actually Predicts
If I had to choose one statistical dimension for batting analysis, it would be conditions splits. A batsman’s performance on seam-friendly surfaces versus flat batting tracks tells you more about how he will perform in a specific match than any aggregate metric. The top-level split is straightforward: average and strike rate on pitches classified as batting-friendly (flat, dry, low seam movement) versus pitches classified as bowling-friendly (green, moist, significant seam or spin).
The deeper layer is opposition bowling type. A right-handed batsman who averages 55 against right-arm pace but 28 against left-arm spin has a massive vulnerability that the headline average of 42 hides entirely. If the opposition’s primary spinner is left-arm, the effective average for this matchup is 28, not 42. I track these batting-versus-bowling-type splits for every player I bet on, and the divergence from the headline average is often the source of my best value bets. The bookmaker prices the headline average; I price the matchup-specific number.

Home versus away splits are the third dimension. A batsman who averages 60 in home conditions and 30 away is not a 45-average player — he is two different players depending on geography. Sub-continental batsmen who dominate on flat, spin-friendly home surfaces often struggle on seaming English or South African pitches, and the reverse applies. I never use a batsman’s home-and-away combined average for a match outside his home conditions. The away-only number, filtered by surface type, is the relevant data point.

Combining Metrics Into a Match-Specific Batting Projection
My batting projection for a specific match uses a weighted combination of four metrics: venue-specific average (40% weight), conditions-adjusted strike rate (25% weight), opposition bowling-type matchup (25% weight), and recent form over the last five innings in the same format (10% weight). The low weight on recent form is deliberate — five innings is too small a sample to override the structural indicators, but it captures short-term changes like injury niggles, technical adjustments, or confidence fluctuations that the longer-term data misses.
The projection outputs an expected score range and a top-batsman probability for each player in the match. I compare these probabilities to the bookmaker’s implied probabilities derived from the top-batsman odds, and bet when the discrepancy exceeds my minimum threshold (10% in ODIs, 15% in T20s, 8% in Tests). The higher threshold for T20s reflects the greater variance in that format — even with perfect analysis, the short innings means a single delivery can determine the top-batsman outcome.

One practical note on data sources: the quality of your model depends on the quality of your input data. I cross-reference multiple sources (ESPNcricinfo for career stats, CricViz for matchup data, Cricmetric for phase-specific splits) and flag any discrepancies before trusting a number. Errors in the data — a miscoded innings, a missing venue classification, an outdated bowling-type assignment — propagate through the model and produce systematic mispricings in the wrong direction. Thirty minutes of data verification before building a match projection is time better spent than thirty minutes of additional analysis on unverified numbers.
